Histogram Visualization
Generate a brightness histogram from an image where the x-axis represents brightness values (0-255) and the y-axis shows the number of pixels with that brightness level.
For grayscale images, displays a white histogram on black background. For RGB(A) images, displays overlapping red, green, and blue histograms.
| Input | Output |
|---|---|
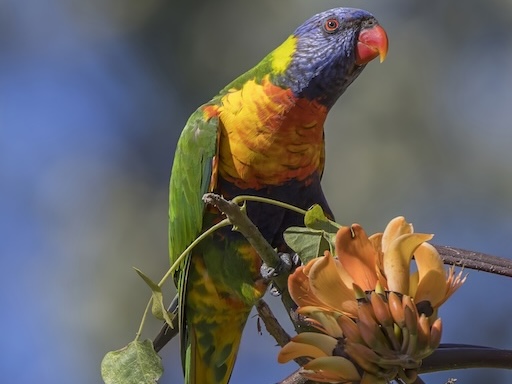 | 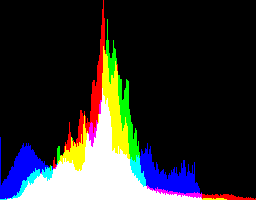 |
$ ./flatcv imgs/parrot.jpeg histogram imgs/parrot_histogram.png
Loaded image: 512x384 with 3 channels
Executing pipeline with 1 operations:
Applying operation: histogram
  → Completed in \d+.\d+ ms \(output: 256x200\) (regex)
Final output dimensions: 256x200
Successfully saved processed image to 'imgs/parrot_histogram.png'
$ git diff --quiet imgs/parrot_histogram.png
Grayscale Histogram
| Input | Output |
|---|---|
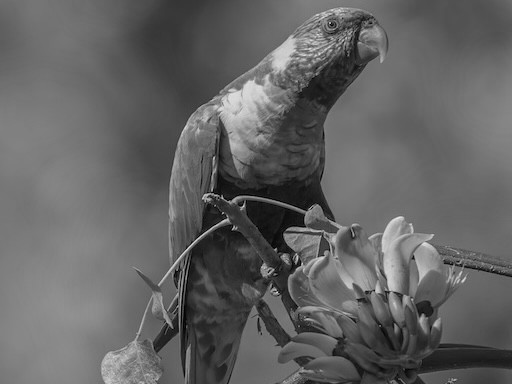 | 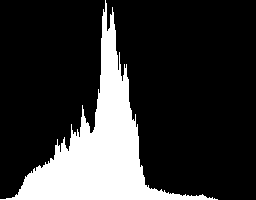 |
$ ./flatcv imgs/parrot_grayscale.jpeg histogram imgs/parrot_histogram_grayscale.png
Loaded image: 512x384 with 3 channels
Executing pipeline with 1 operations:
Applying operation: histogram
  → Completed in \d+.\d+ ms \(output: 256x200\) (regex)
Final output dimensions: 256x200
Successfully saved processed image to 'imgs/parrot_histogram_grayscale.png'
$ git diff --quiet imgs/parrot_histogram_grayscale.png